This was first published on the blog at my other business: Objectivity
I’ve been creating, building or transforming businesses for over 25 years now, but before that I was a developer. And whilst it’s been a long time since I wrote software professionally, I still love to have a side project to help me learn new things (and it’s a more useful hobby than doing a crossword!).
A few months ago, I came across Adrian Rosebrock and his site pyImageSearch. He has a great style and gives away loads of free resources to readers who are interested in computer vision.
Systematic analysis of images / videos using computer vision and AI techniques is a really hot topic at the moment. The rise of Nvidia and its sideways land grab into the world of machine learning gives us an indication of how closely these two fields are related. I expect to see acceleration, not a slowing down here.
Adrian’s last update concerned the analysis of images for colourfulness and responding to a reader’s question, he offered some strategies then took one of them to conclusion. I was intrigued by one of his alternatives and thought I’d take the opportunity to learn some more about this amazing technology.
The challenge was to build an analysis of the colourfulness of an image and then show the original image but with some visualisation of how colourful it was, overlaid.
But first, I needed an image that had some colourful regions:
Here’s Basil!
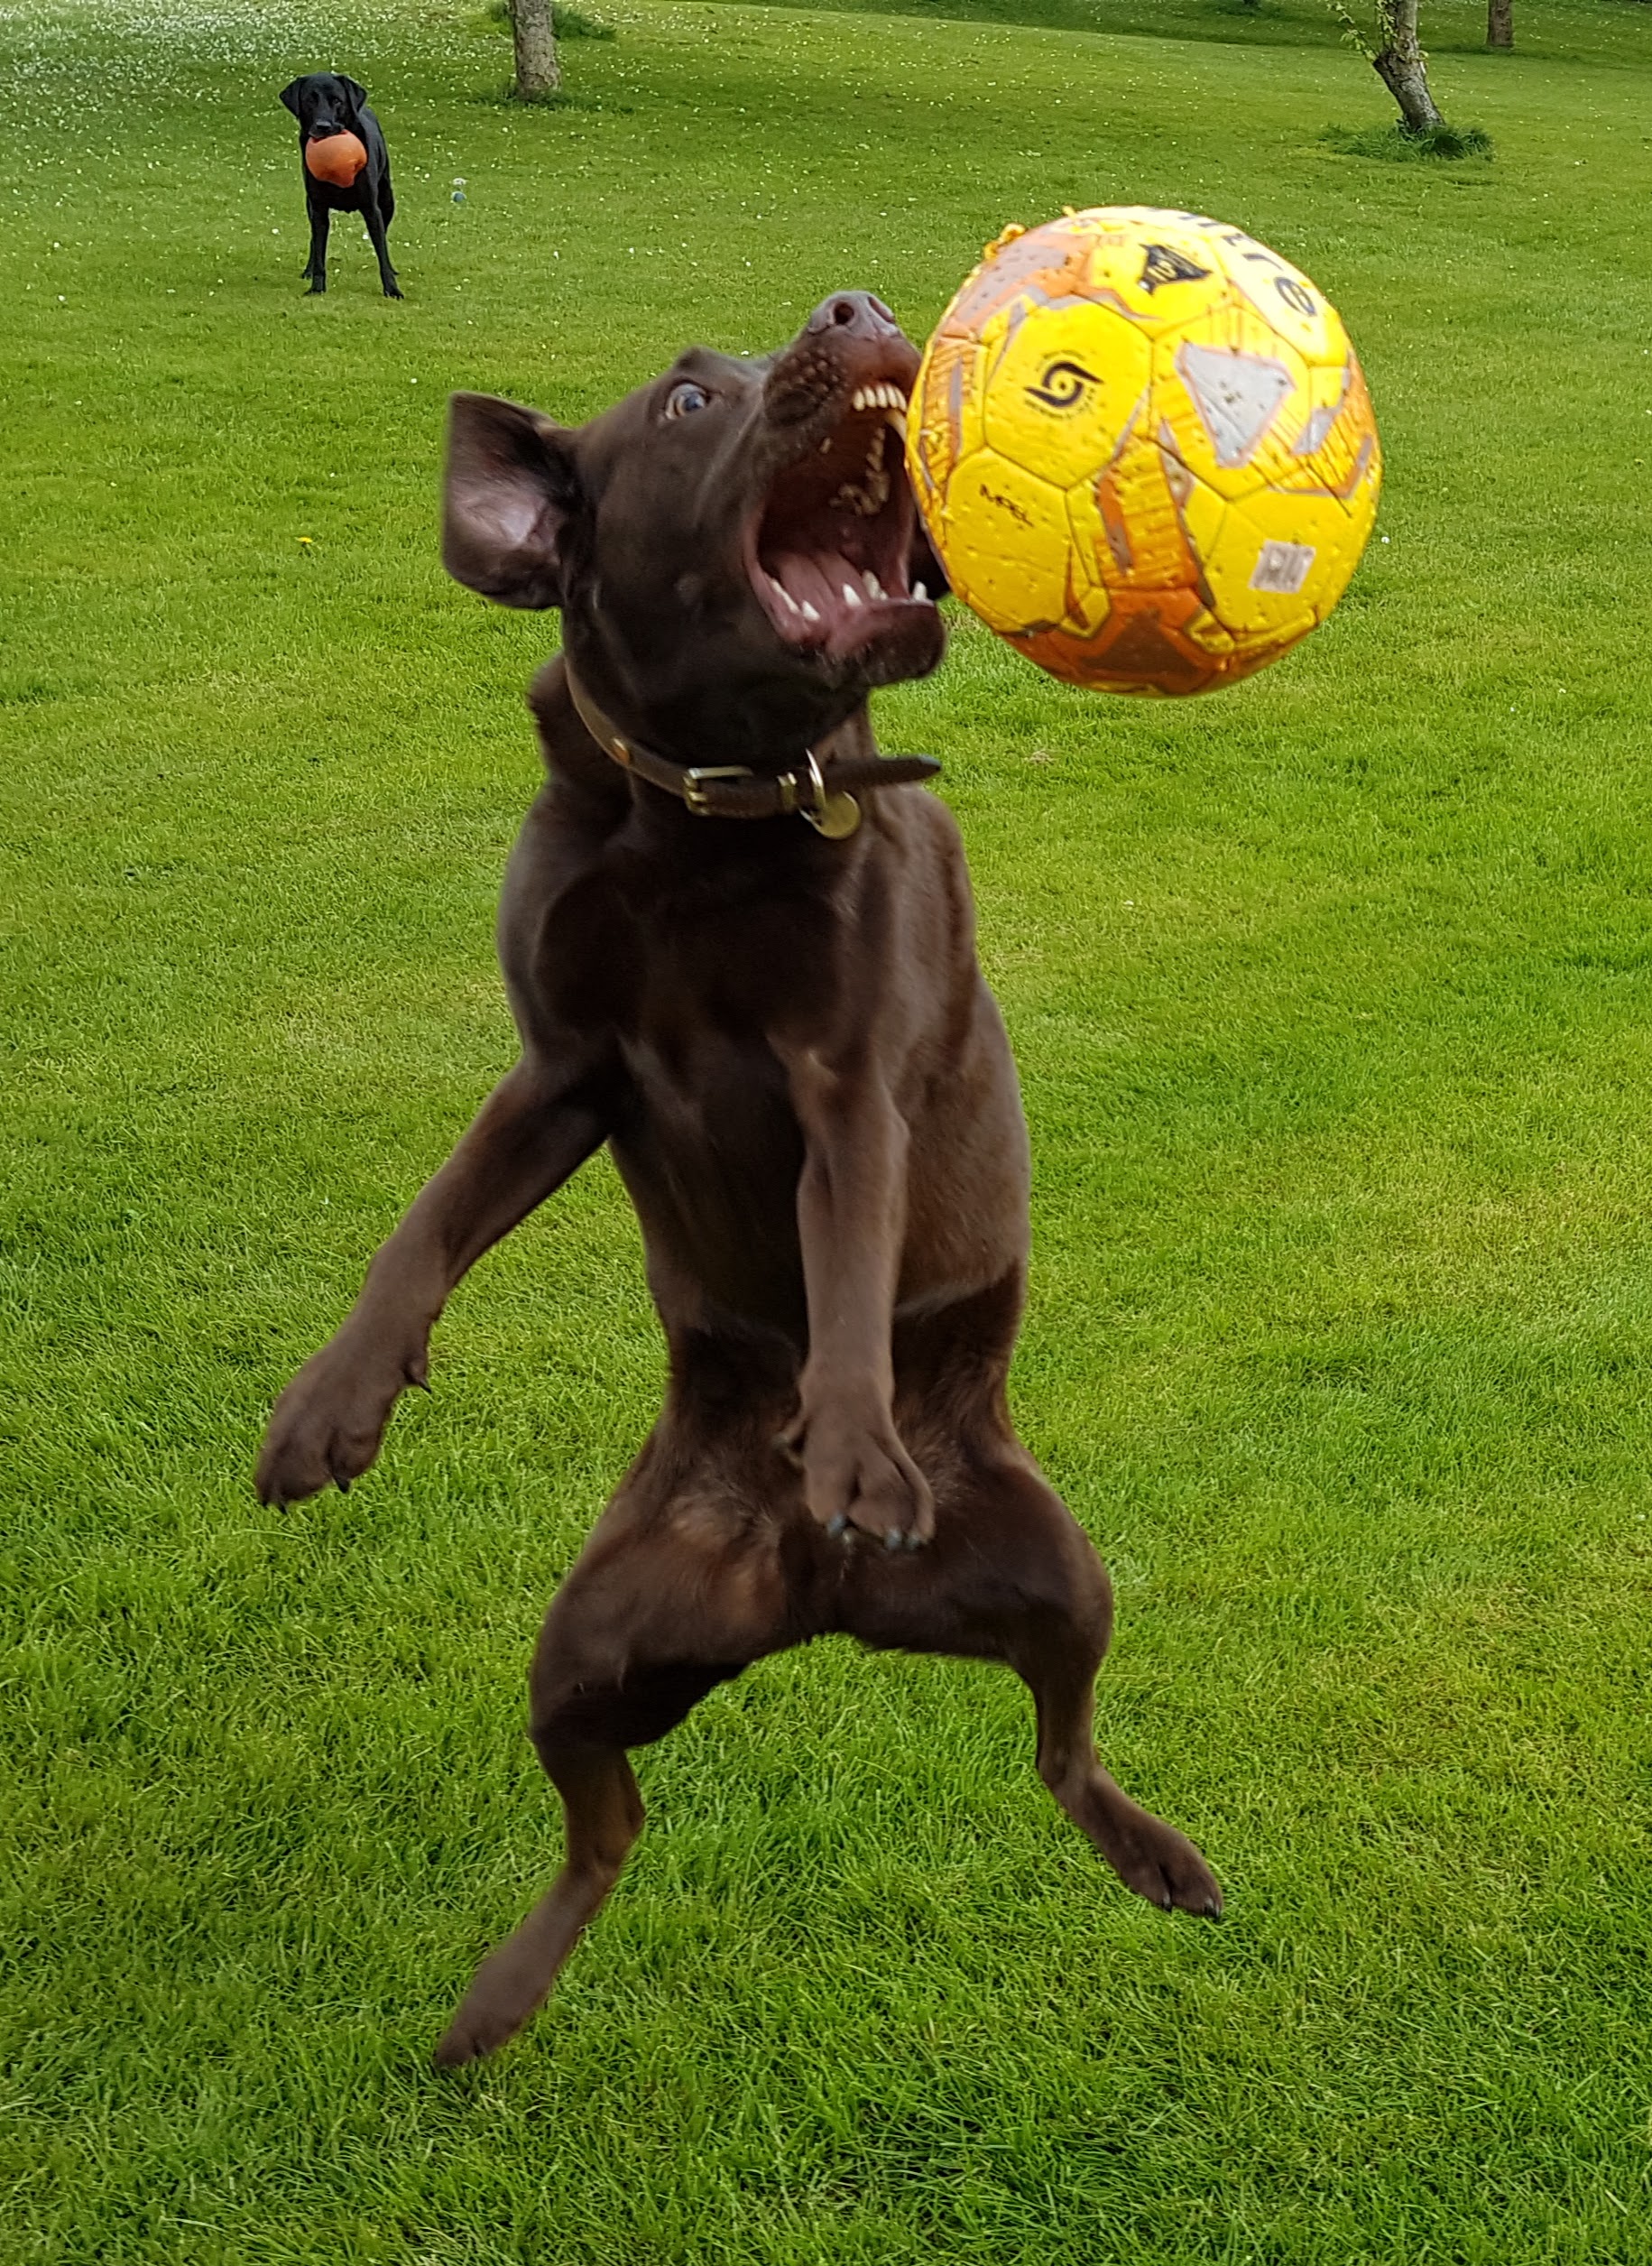
He’s a footballing, fearless five year old Chocolate Lab.
We can see Boris (alpha dog!) in the background as well!
Tactics
I took the short function provided by Adrian (after David Hassler and Sabine Süsstrunk) in a previous blog to calculate the colourfulness of an image. I then used it instead to calculate the same for a subsection (or Region Of Interest, ROI) of the main image.
In a straightforward way, I looped over the rows in the image and then the pixels in each row. For each pixel, I put it at the centre of an ROI and then calculated the colourfulness of the ROI. I stored the colourfulness and of course it created a matrix the same shape (minus half the width of the ROI) as the main image.
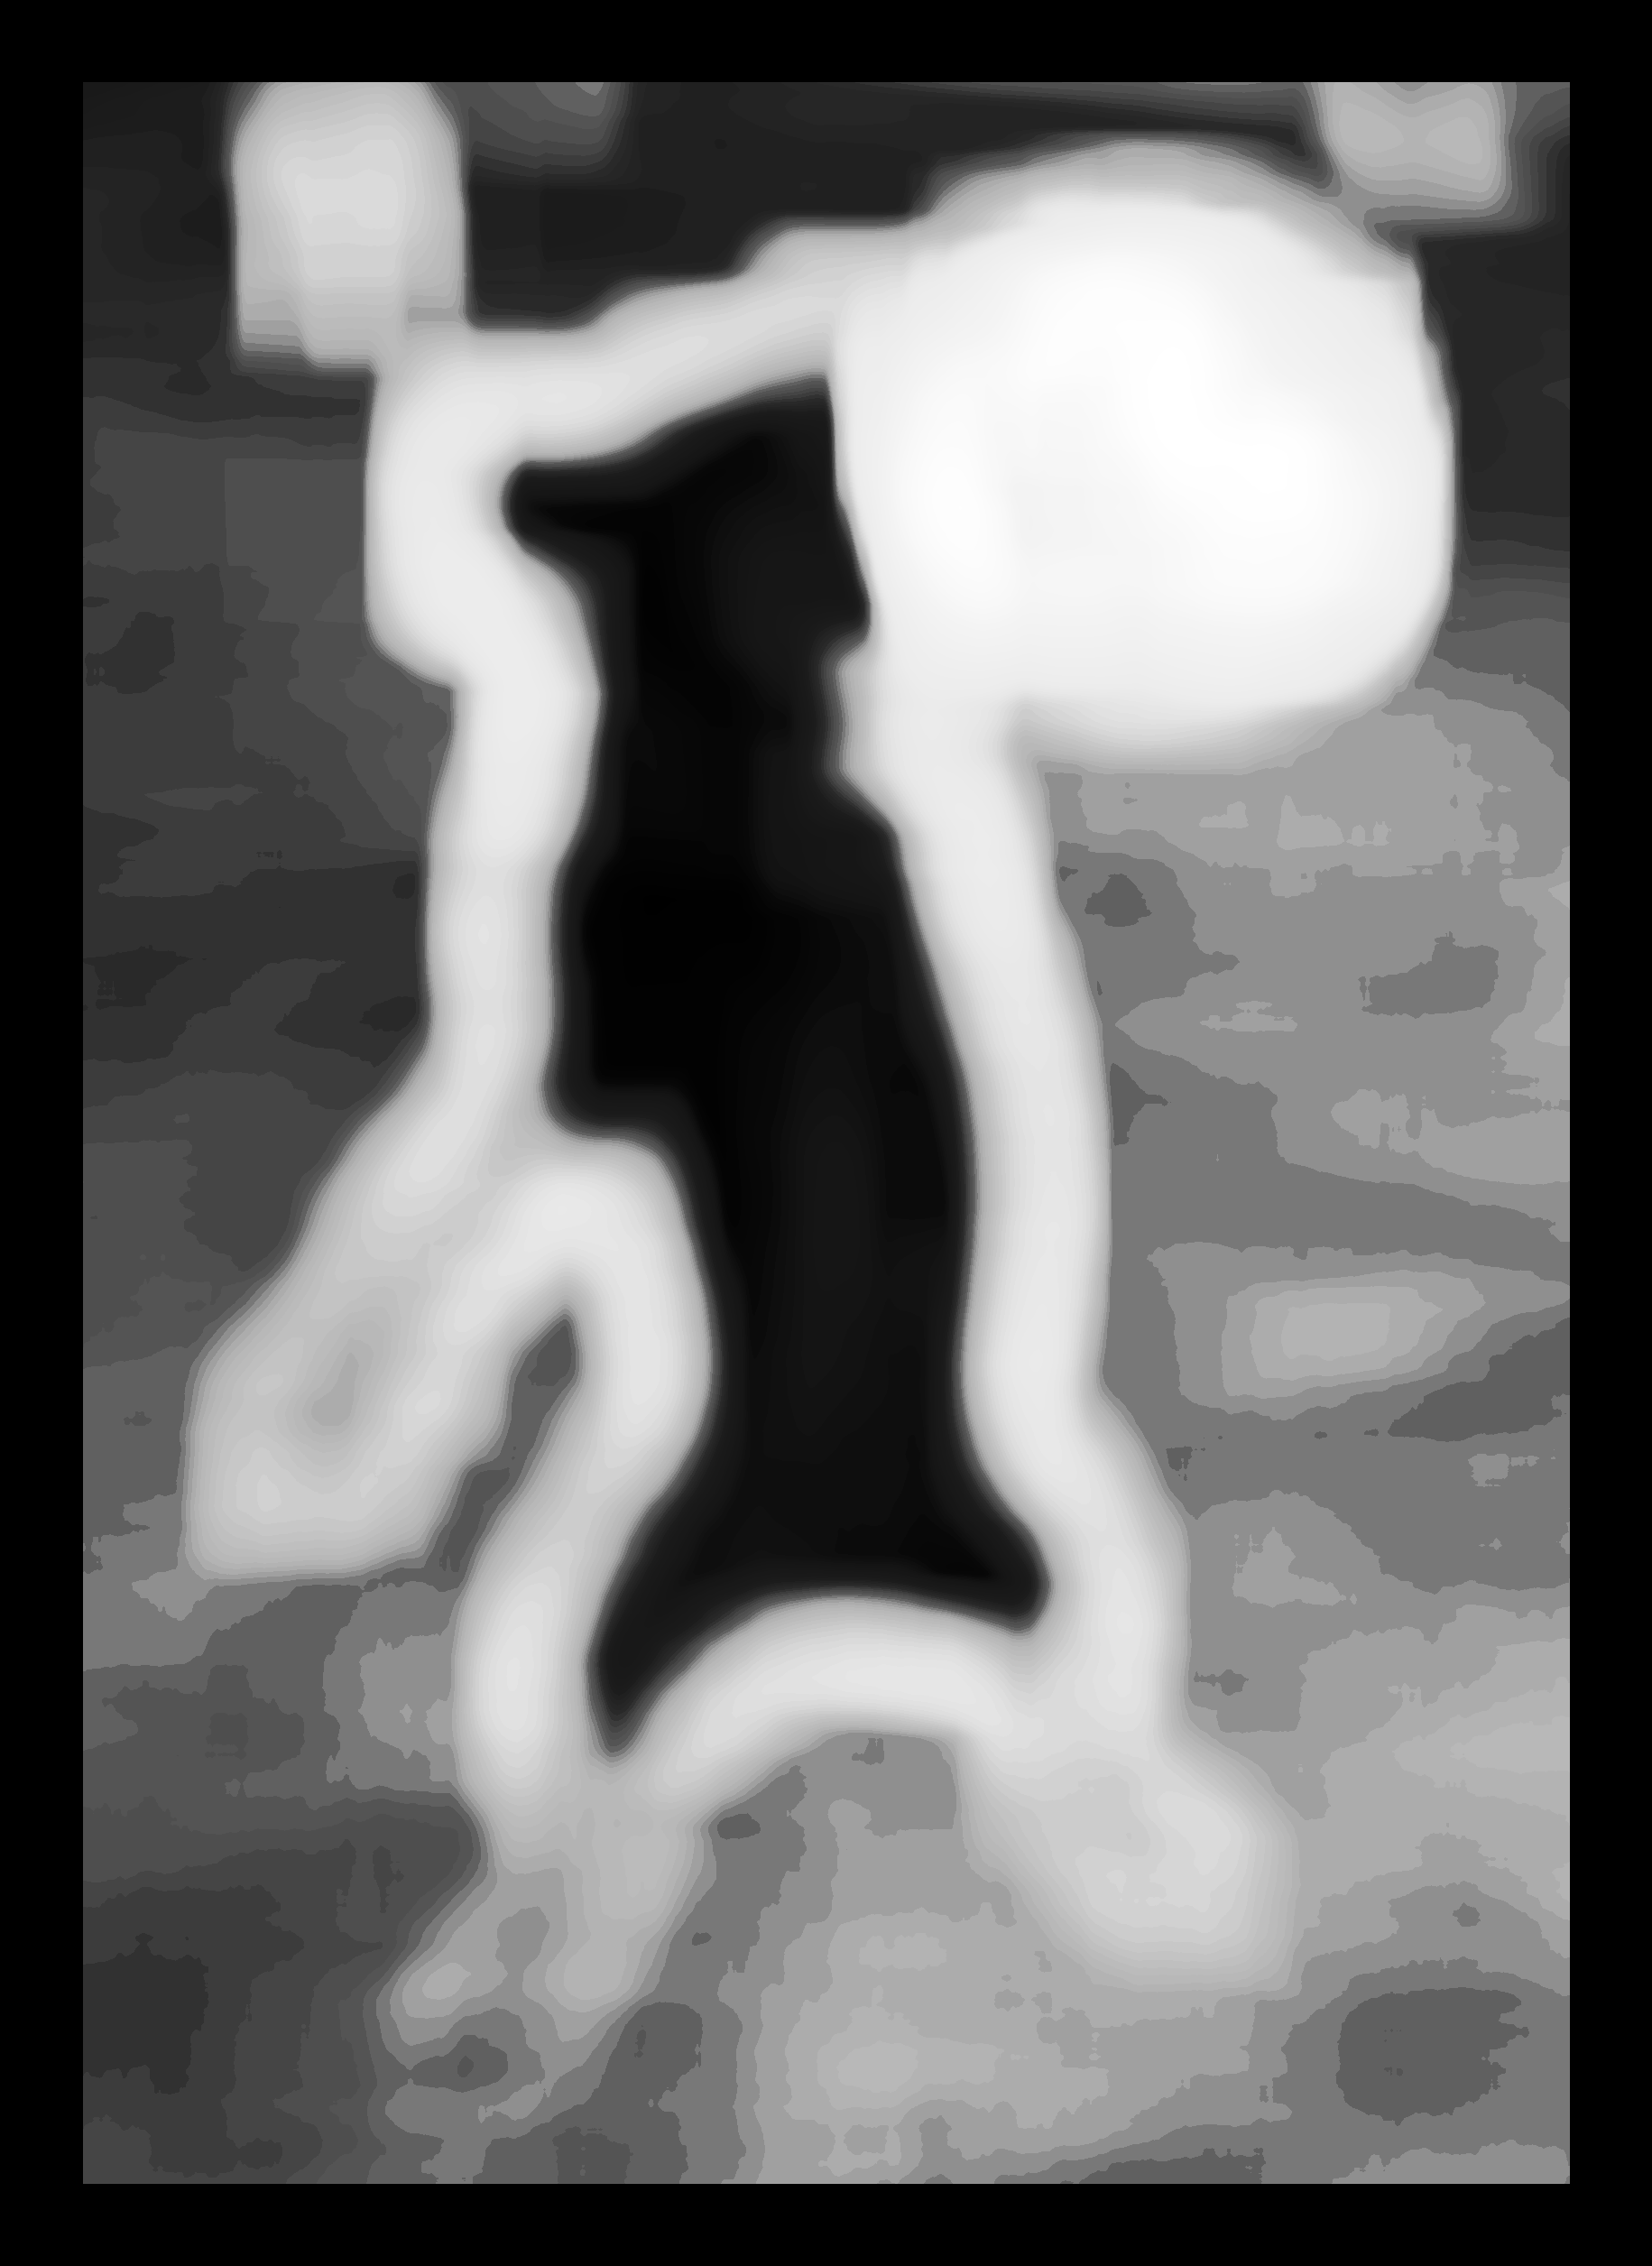
Then I did a bit of arithmetic to stretch the colourfulness and created the following image. It shows the most colourful areas as lighter:
With the first image safely saved away, it’s onto the second. How could I create an overlay so that we can see the original image more clearly than above and we can still get a sense of the colourfulness?
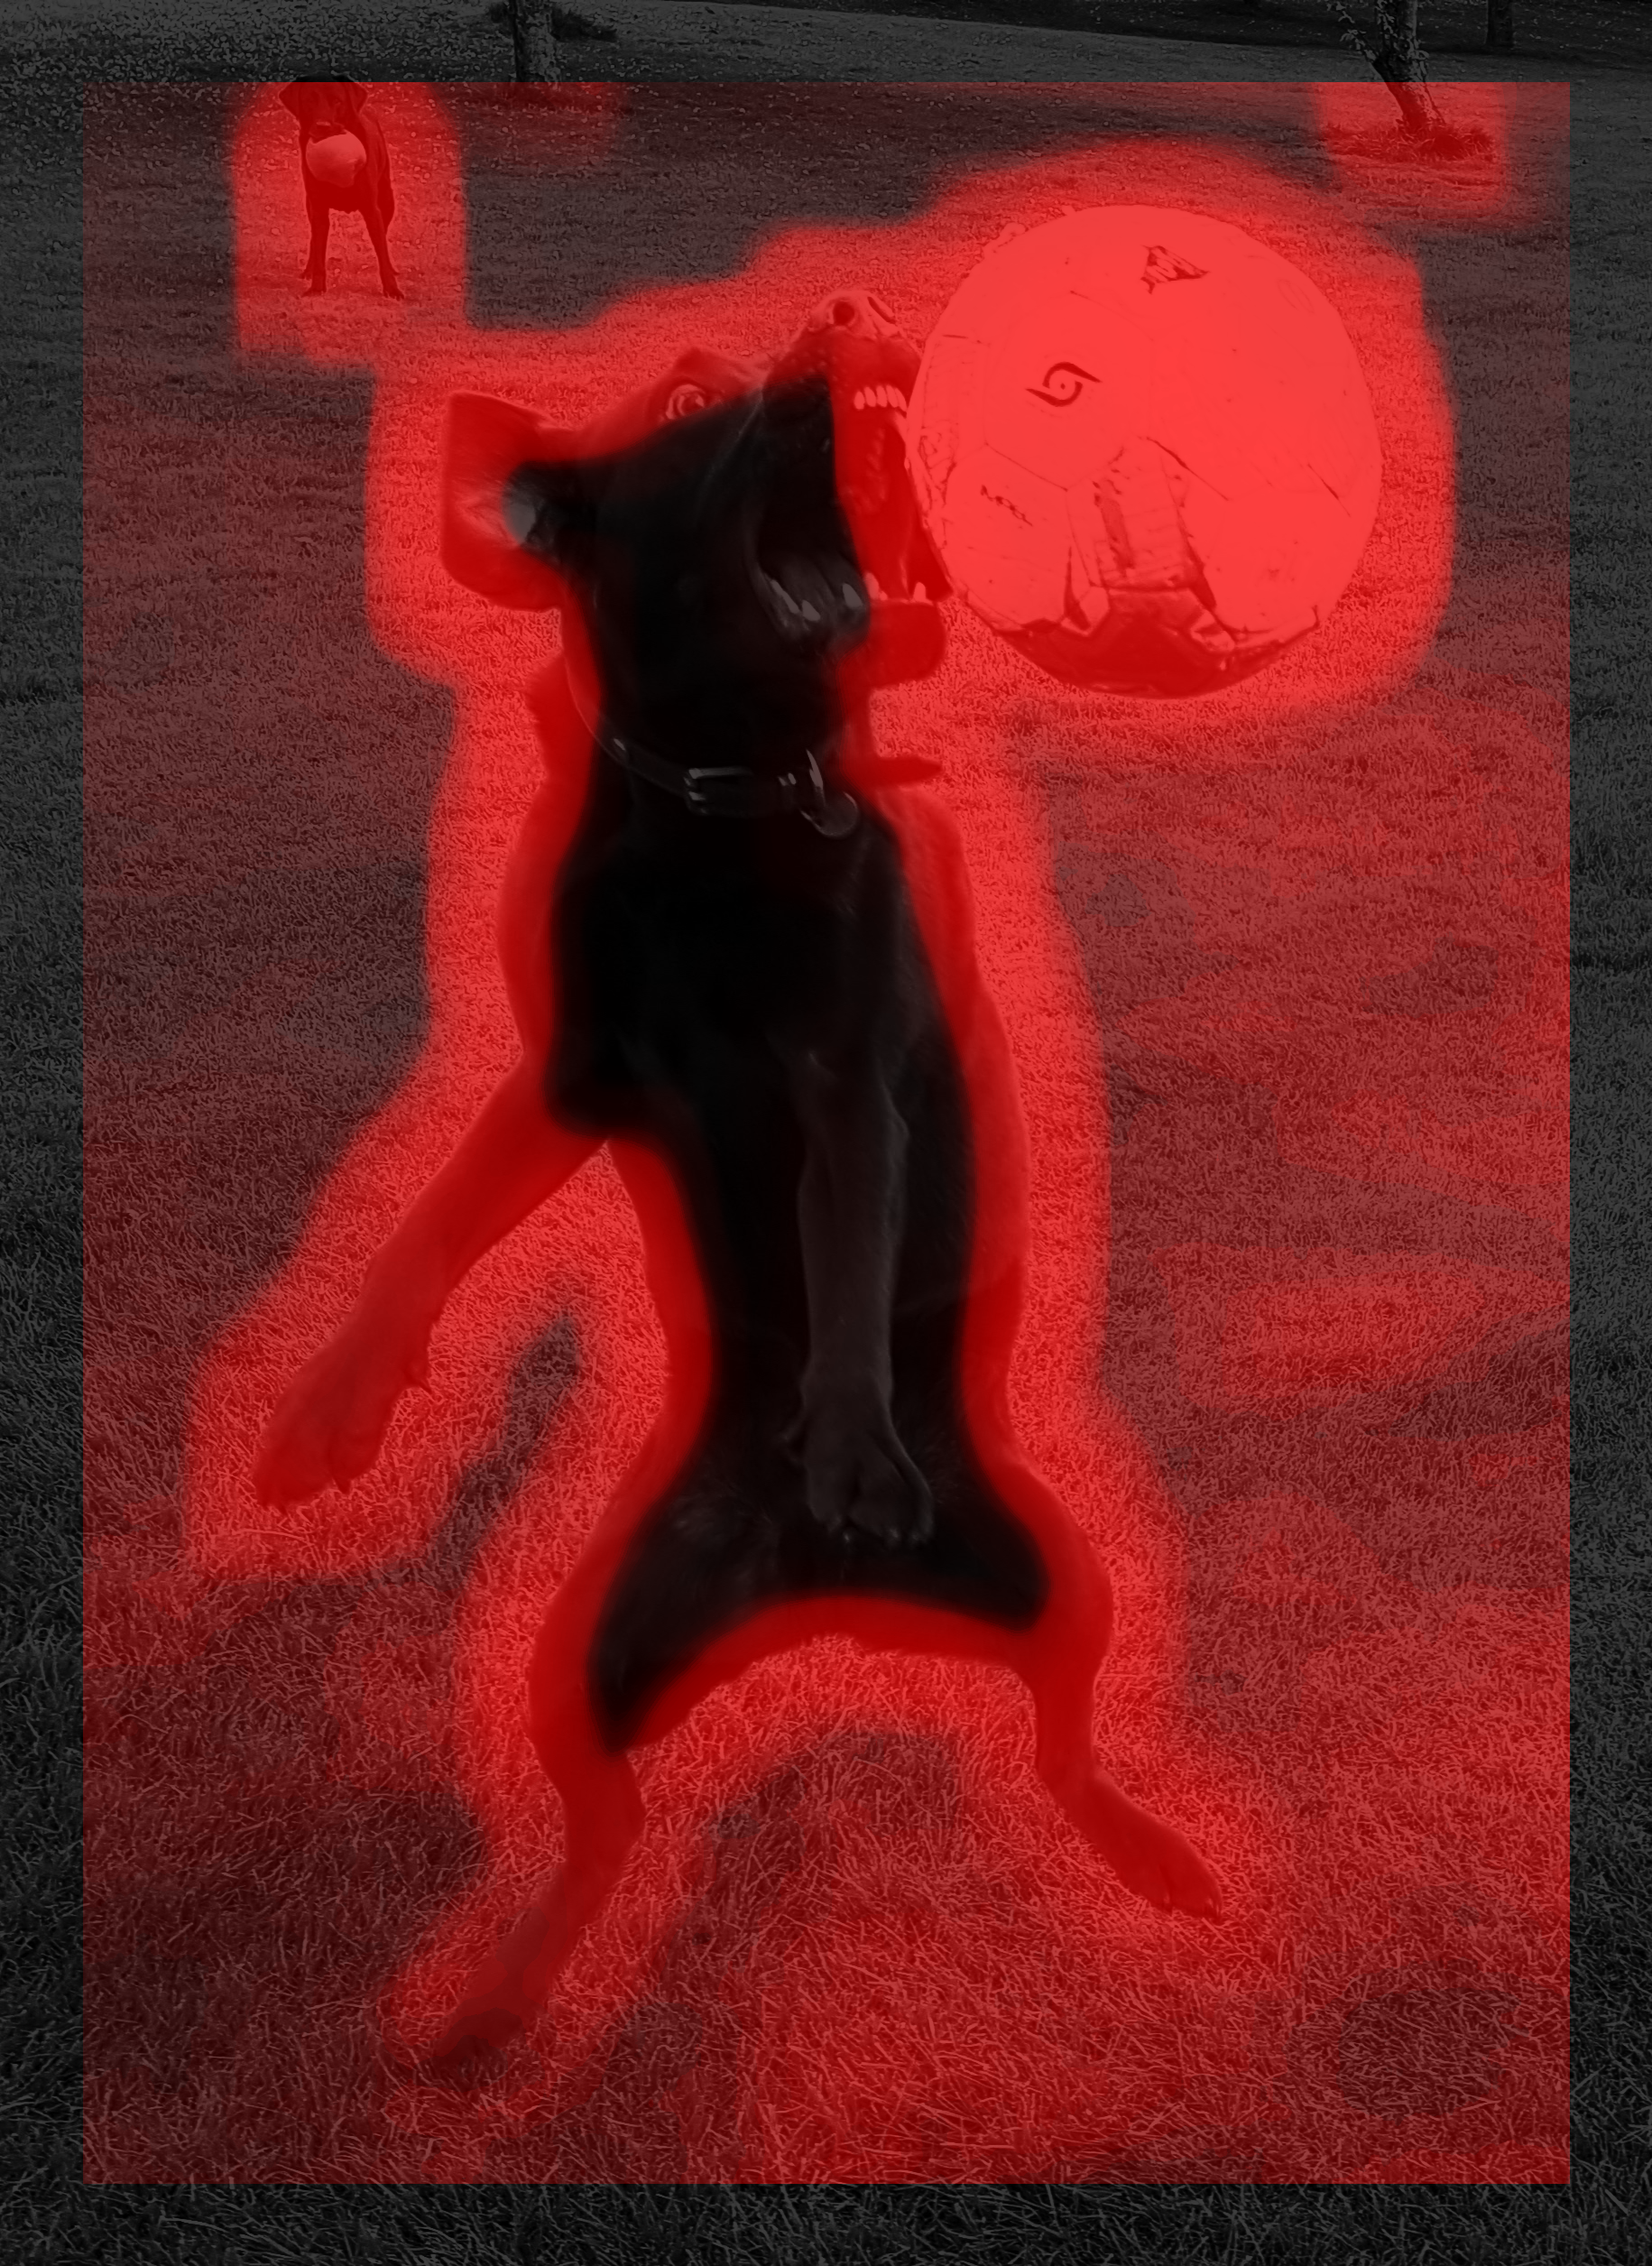
We can take the original image, make it grayscale only then add two duplicate channels to facilitate a bit of colour. Then take the analysis image above and combine it with the duplicated red channel (with some squashing and squeezing of the colour space) to make the most colourful areas appear red.
A picture speaks a thousand words. Have a look below:
I confess that I’m struggling at the moment to see what the practical application of visualising the colourfulness of an image would be! Maybe in the medical world it could be useful to draw a researcher’s eye towards a ROI on a scan that was above a threshold? If you have any great ideas, please let me know!
However, the ability to systematically identify the most colourful parts of an image in order to conduct some further processing could definitely be useful.
For me, the fact that I delved into a toolstack for image analysis and successfully completed some basic analytical processes and manipulation was a good result.
If you’re interested in the technical bits, the program is written in Python 3 with use of numpy and opencv3. I didn’t do any performance optimisation and the process is quite intensive. So be warned it took about 1.5 hours to generate the large images (about 4seconds for the shrunk versions).
This problem tickled my fancy, kept me entertained for a few hours, taught me some new things and is part of “smashing myself into new ideas”. It’s one of the techniques we use to increase our ability to innovate.
If you’d like to know anything more about my little side project, you can find the code on my personal github page
If you’d like to know anything more about the innovative ways we help companies solve their hardest problems en route to their digital transformation, please drop me a line.
And finally, if you’re nursing your own side project, I’d love to hear about it!